Band structure calculations
In the previous tutorial, we calculated the total energy of silicon and explored its Brillouin zone convergence. This tutorial illustrates calculations of the electronic band structure, specifically, the variation of the Kohn-Sham eigenvalues along a special kpoint path in the Brillouin zone.
First lets specify the bulk silicon energy calculation in Si.yaml, or reuse the file from the Brillouin-zone sampling:
lattice:
  system:
    name: cubic
    modification: face-centered
    a: 10.263

ions:
  pseudopotentials:
    - SG15/$ID_ONCV_PBE.upf
  coordinates:
    - [Si, 0, 0, 0]
    - [Si, 0.25, 0.25, 0.25]

electrons:
  k-mesh:
    offset: [0.5, 0.5, 0.5] #Monkhorst-Pack
    size: [8, 8, 8]

grid:
  ke-cutoff: 100 #Hartree

checkpoint_out: Si_out.h5
which can be run with
(qimpy) $ python -m qimpy.dft -i Si.yaml -o Si.out
Next, we list high-symmetry points in the Brillouin zone laying out a path along which we want the band structure, which can be put in kpoints.yaml:
include: Si.yaml

electrons:

  fillings:
    n-bands: 10
    n-bands-extra: 5

  fixed-H: Si_out.h5 #fixed Hamiltonian so there's no more SCF

  k-mesh: null #de-specify the k-mesh from Si.yaml

  k-path:
    dk: 0.05
    points:
      - [0, 0, 0, $\Gamma$]
      - [0, 0.5, 0.5, X]
      - [0.25, 0.75, 0.5, W]
      - [0.5, 0.5, 0.5, L]
      - [0, 0, 0, $\Gamma$]
      - [0.375, 0.75, 0.375, K]

checkpoint-out: null #de-specify the checkpoint file creation from Si.yaml
Note that you can overwrite previously specified values when using include. The high symmetry points for many structures can be found easily online, such as this course website . Or you can use the more complete Bilbao database but you’ll need to know the point group of your crystal.
Then you can calculate the band structure along the k-point path with
(qimpy) $ python -m qimpy.dft -i kpoints.yaml -o kpoints.out
and if you investigate the electron fillings using h5dump -g electrons/fillings kpoints.h5 then you can see that half of the bands are filled completely, while the other half are completely empty, in line with what is expected for a semiconductor.
And to generate the band structure plot, run
(qimpy) $ python -m qimpy.interfaces.bandstructure -c kpoints.h5 -o Si_bandstructure.png
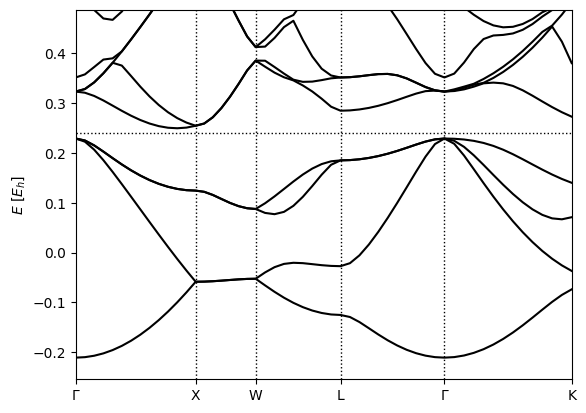
which should produce
Notice that at the Gamma point, the lowest band is single while the next three higher bands are degenerate: these line up with the s and p valence orbitals on the Silicon atoms. These degeneracies change in different parts of the Brillouin zone: the XW segment has two pairs of degenerate bands, while the WL and Gamma-K segments have no degeneracies.